 NK
NK
Why one-at-a-time fell over
Our original pipeline treated every creator lookup as a single Celery task. Handles were queued in Redis, and workers pulled them off one at a time. It was simple and it worked — until customers started sending us batches of tens of thousands of creators at once.
The bottleneck wasn’t any single slow step. It was that the whole system was effectively serial: throughput was capped by worker count and Redis queue depth, not by the work itself. At ~3,500 creators/hour, a large enterprise batch ate most of a business day. Retries were manual, failures were hard to trace, and we had no clean way to reprocess profiles that didn’t resolve on the first pass.
We didn’t have a speed problem. We had a serial problem.
We didn’t need lower latency on a single lookup — we needed throughput: the ability to fan a huge batch out across many workers and pull it back together reliably.
What we built instead
We evaluated the obvious alternatives for each layer and picked deliberately. Every component here earns its place — and we’ll tell you what we rejected and why.
Kafka for event streaming
We needed durable, replayable queues that decouple ingestion from processing — if a downstream stage falls behind or crashes, events aren’t lost. We chose Kafka over SQS and RabbitMQ because retained, replayable logs let us reprocess a batch or recover a failed stage by rewinding an offset rather than re-collecting from the source — and because partitioned topics let us scale consumer parallelism horizontally as batch sizes grow, instead of contending on a single queue.
Prefect for orchestration
Dynamic, parallel sub-flows let us fan work out across sources and pull it back together with run-level observability for free. We chose Prefect over Airflow and Temporal because we needed to spawn sub-flows dynamically at runtime based on what’s in each batch — something Airflow’s static, schedule-first DAG model fights against — while keeping flows as ordinary Python that engineers can run and debug locally without standing up a worker cluster or learning a new execution model.
ClickHouse for results storage
Columnar storage handles our high-volume writes and analytical read patterns far better than a row store. We chose ClickHouse over Postgres and Snowflake because it ingests and aggregates across our enriched-profile dataset at a fraction of the cost and latency of a warehouse like Snowflake, while sustaining write throughput that a row-oriented store like Postgres would choke on at our batch sizes — and it already backs the rest of our analytics stack, so there was no new operational surface to learn.
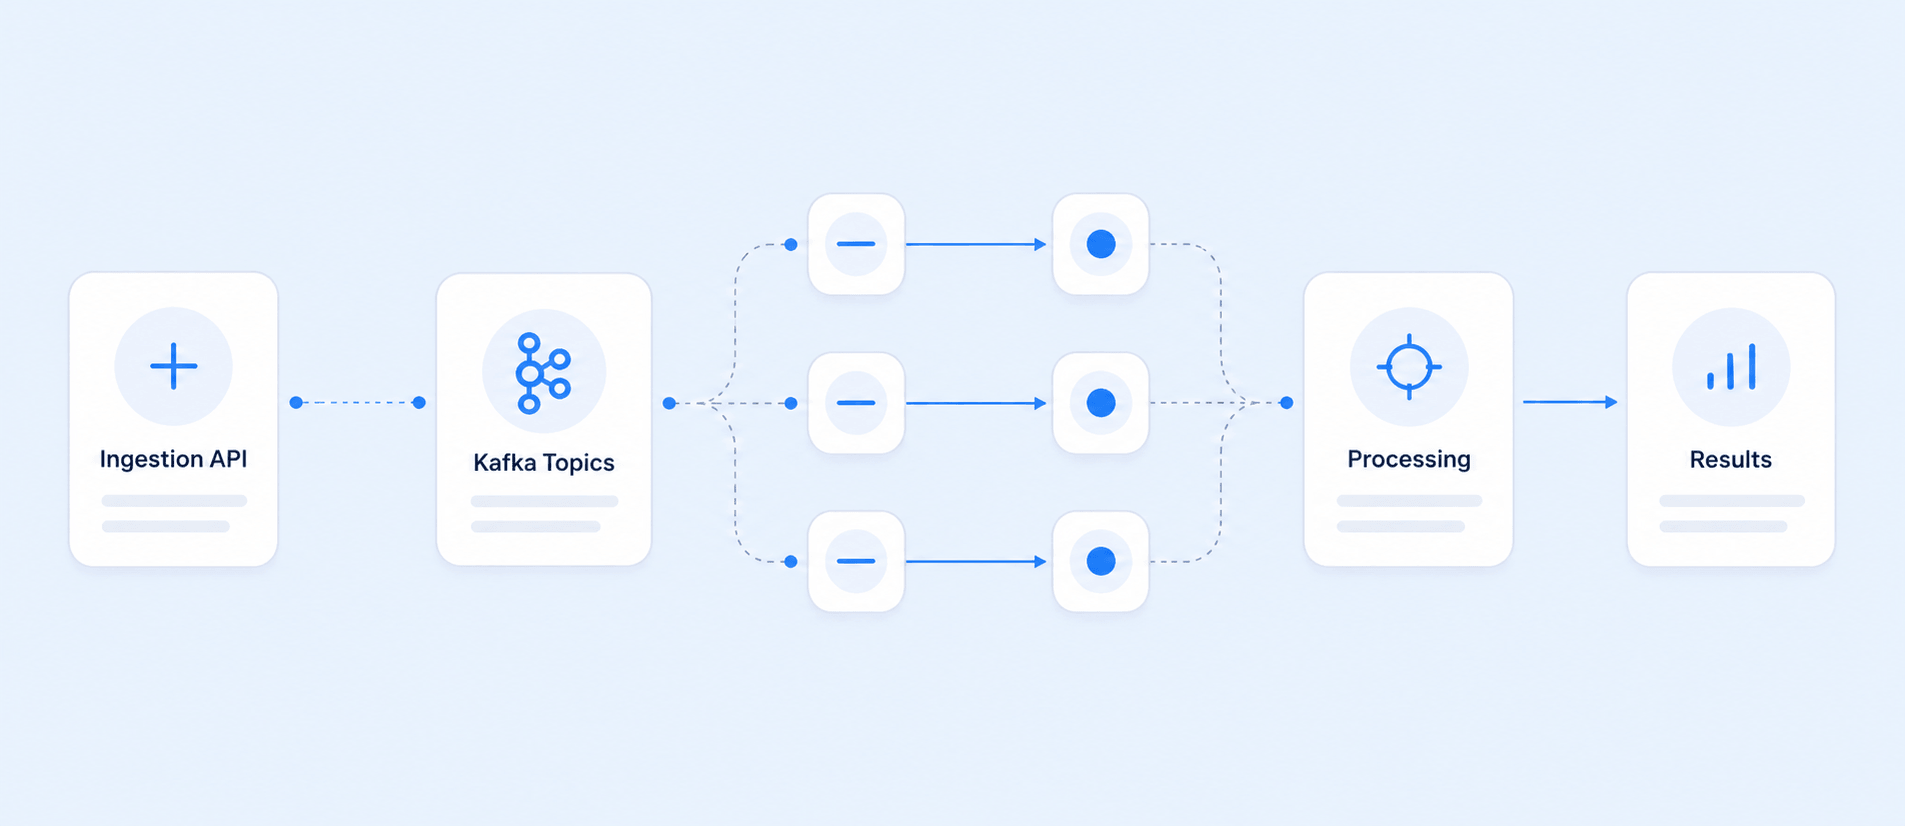
At a high level, data flows from API ingestion → a collection orchestrator → an enrichment pipeline → the customer dashboard, with Kafka topics connecting each stage and a Dead Letter Queue catching anything that fails.
1Ingestion
The API accepts batches of handles, user IDs, and profile URLs. After validation and credit checks, every input is written to a Kafka topic. Each input carries a unique idempotency key, so a creator that appears twice — or a batch that gets retried — never produces duplicate work downstream.
2Collection orchestrator
A Prefect flow runs every minute, reads pending inputs off the Kafka topic, and spins up sub-flows grouped by source and input type. Each sub-flow runs tasks that process up to 100 inputs in parallel, posts results to a results topic, and shuts down.
Nothing fails silently. If it breaks, we can see it, count it, and replay it.
3Enrichment pipeline
A second orchestrator runs every minute and consumes two topics: the DLQ (not-found and exceptions) and the results queue (successful lookups). It triggers data-engineering sub-flows that apply our enrichment algorithms, then writes to two ClickHouse tables:
- Status tableShort-lived per-job tracking: original client input, found status (true/false/null), user ID, and timestamps. This is the table the customer’s job reads from; rows are aged out after the job completes.
- Profiles tableOur canonical creator profiles, fed by the same standard pipelines that power the rest of the platform.
The orchestrator maintains a table of required computations and triggers sub-flows in dependency order, so each enrichment step runs only after its inputs are ready.
This runs in production every minute of every day. The interesting part isn’t that it’s fast — it’s that it’s predictable.
4Delivery
The dashboard polls the status table every minute, matches client inputs back to enriched creators, and updates rows as final data lands.
What we’d still change
A few things we made peace with, and a few we’re still improving:
- Polling, not pushing.Three stages poll on a one-minute cadence. It’s simple and debuggable, and one minute is well inside our customers’ tolerance — but it does add up to a minute of avoidable latency per hop. Moving the delivery layer to event-driven updates is on our roadmap.
- At-least-once, not exactly-once.Kafka gives us at-least-once delivery, so idempotency keys do real work here. We accept occasional duplicate processing in exchange for never dropping a record.
- The DLQ needs babysitting.Early on, a class of unavailable and region-locked profiles flooded the DLQ and masked real failures. We now tag DLQ entries by failure reason and alert on DLQ growth rate so genuine incidents stand out.
Where it landed
The headline isn’t latency — a single lookup is about as fast as it ever was. The win is throughput. By replacing serial Celery tasks with parallel Prefect flows over Kafka, concurrency is now bounded by how many tasks we can launch, not by Redis depth or worker availability.
| Metric | Before | After |
|---|---|---|
| 100k-creator batch | ~13 hours | ~1 hour |
| Peak throughput | ~3,500/hr | ~100,000/hr |
| Failed records lost | manual recovery | 0 — all via DLQ |
| Concurrent collection tasks | ~50 | ~1,000 |
This is the infrastructure behind our enrichment API. It’s fast today, predictable under load, and built with headroom we haven’t needed yet.
Build on the creator data layer
340M+ creators, multi-platform data, 200+ insights via API, dashboard or MCP server.