
Free Engagement Rate Calculator
Get engagement rate and other metrics from 340M+ influencers for free. No signup.
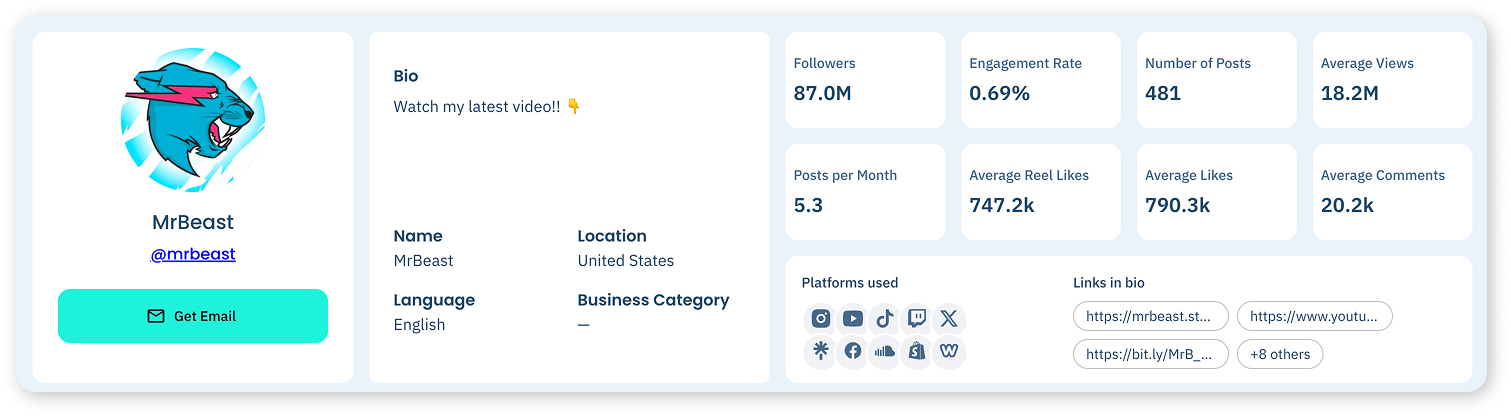
Sample output for @mrbeast. Run the tool on any Instagram handle for a live report.

MrBeast
@mrbeast
Get EmailBio
Watch my latest video!! 👇
- Name
- MrBeast
- Location
- United States
- Language
- English
- Business Category
- Arts & Entertainment, Lifestyle
- Followers
- 88.9M
- Engagement Rate
- 2.23%
- Number of Posts
- 500
- Average Views
- 44.8M
- Posts per Month
- 5.3
- Average Reel Likes
- 1.6M
- Average Likes
- 4.1M
- Average Comments
- 59.5k
Platforms used
Links in bio
https://youtu.be/Af6i6ChAVTwEstimated Revenue
Monthly
$1,714,800 – $2,229,300
Revenue Range
Similar Accounts

MrBeast Store
- Followers
- 1.4M
- Engagement Rate
- 0.36%

Chandler Hallow
- Followers
- 5.2M
- Engagement Rate
- 1.27%

Ava Tyson
- Followers
- 1.9M
- Engagement Rate
- 14.37%

PewDiePie
- Followers
- 19.4M
- Engagement Rate
- 7.09%

Lazar Beam
- Followers
- 2.8M
- Engagement Rate
- 7.90%

DramaAlert
- Followers
- 515.2k
- Engagement Rate
- 1.25%
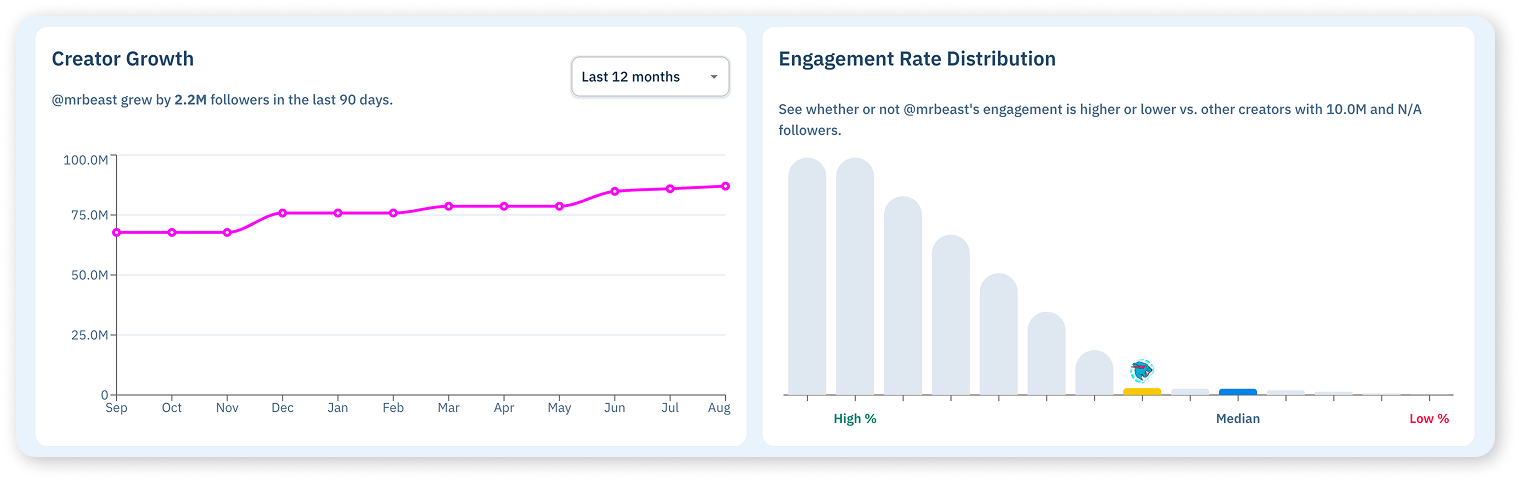
Creator Growth
@mrbeast grew by 2.2M followers in the last 90 days.
Engagement Rate Distribution
See whether or not @mrbeast's engagement is higher or lower vs. other creators in the same follower band.
Audience Insights
Categories derived from bio, hashtags & language signals
Audience Credibility
Scored against creators in the 88.9M follower band.
Top Locations
+6 more countries
Age & Gender
Audience Interests
+20 more interest categories
Tagged Creators
 thea
thea tareqq
 cristiano
 karljacobs
 nolanhansen
Tagged Brands
 boxbollen1 post(s)
 ishowspeed1 post(s)
 haleyybaylee1 post(s)
 cheetah1 post(s)
 derwinjames1 post(s)
Hashtags
Sample report shown for illustration. Run the tool above for a live report.
The basics
What is engagement rate?
Engagement rate is the share of people who interacted with a creator’s content, shown as a percentage. It takes the interactions on a post (likes, comments, shares, depending on the platform), divides them by the audience that could have seen it (followers or views), and multiplies by 100. It is the fastest way to tell whether an audience is paying attention or just counted.
Two creators with 100,000 followers can post the same kind of content and get 800 likes on one account and 8,000 on the other. Follower count treats them as equals. Engagement rate does not, which is why it is the first number a brand, agency or creator should check before pricing a partnership.
(likes + comments) ÷ followers × 100
The classic formula. Works when most of a creator’s reach comes from people who already follow them, which is still largely true on Instagram feed posts.
(likes + comments + shares) ÷ views × 100
The formula for platforms where the algorithm decides reach. On TikTok, YouTube and Instagram Reels, views often have little to do with followers, so this is the rate that reflects what actually happened.
Inside the result
What the engagement rate calculator shows you
One number on its own is easy to misread. The calculator returns the rate together with the metrics that explain it.
The rate, plus the numbers behind it
You get the engagement rate calculated the right way for the platform, averaged across the creator’s recent posts rather than pulled from one. Next to it sit average likes, comments and views, posting frequency and follower count, so you can see whether the rate comes from consistent interest or from a single post that ran away.
- Engagement rate
- Followers
- Average likes
- Average comments
- Average views
- Posts per month
- Total posts
On Instagram, Reel likes are split out from feed likes because the two behave differently, and a blended average hides which format carries the account.
Where the rate sits against creators of the same size
An engagement rate is only good or bad relative to the account size. A 2% rate is strong for a creator with 2M followers and weak for one with 5,000. The calculator places the creator on an engagement rate distribution built from accounts in the same follower band, so “is this good” gets answered for that size rather than in the abstract.
Next to it you get the follower curve over the last 12 months and the followers added in the last 90 days. A steady climb reads very differently from a vertical spike followed by a flat line, and a spike without matching engagement is the clearest sign an audience was bought rather than built.
Every account the creator runs, not just the one you typed
Most engagement rate calculators check one handle on one platform. This one resolves the creator behind the handle and shows every account connected to them, with follower counts on each. A creator whose Instagram engagement looks average might be pulling ten times the interactions on YouTube or TikTok, and that changes what you are buying.
Matching runs against 340M+ creator profiles, with connected accounts tracked across 47 platforms, which is why the result finds channels a single platform search never surfaces.
- Linked accounts
- Followers per platform
- Public bio
- Links in bio
- Location
- Language

By platform
How engagement rate is calculated on each platform
What counts as an interaction, and what you divide it by, changes from one network to the next. The calculator applies the formula that fits the platform you pick.

Instagram engagement rate
(likes + comments) ÷ followers × 100
The follower-based rate still works for feed posts. For Reels, a view-based rate is more honest, since Reel reach is driven by the algorithm rather than the follower list. Feed likes and Reel likes are reported separately.
Instagram engagement rate calculator
TikTok engagement rate
(likes + comments + shares) ÷ views × 100
TikTok runs on views, not followers. A creator with 20k followers can routinely pull a million views, so a follower-based rate on TikTok produces numbers that mean nothing. Shares count because they are what drives distribution.
TikTok engagement rate calculator
YouTube engagement rate
(likes + comments) ÷ views × 100
Views are the denominator, and the view-to-subscriber ratio matters just as much. A channel with 200k subscribers and 4k average views is a very different buy than one with 50k subscribers and 40k views. Upload consistency rounds out the picture.
YouTube engagement rate calculator
X (Twitter) engagement rate
(likes + replies + reposts) ÷ views × 100
X shows a view count on every post, so views are the denominator, the same as TikTok and YouTube. Replies and reposts weigh more than likes in practice, because a post that gets argued with or passed on travels much further than one that gets a heart.
X engagement rate calculator
Twitch engagement rate
average viewers ÷ followers × 100
Twitch has no likes to count. Engagement is how much of the follower base actually shows up to a live stream, read alongside stream frequency and follower growth. A channel with 500k followers and 800 average viewers is not a 500k-reach buy.
Profile analyzer
OnlyFans engagement rate
total likes ÷ total posts
Subscriber counts are not public on OnlyFans, so the useful measure is average likes per post from the public profile, compared with creators posting at a similar volume. It shows whether an audience is active or just subscribed once and left.
Profile analyzerBenchmarks
What is a good engagement rate?
There is no single answer, and any calculator that gives you one is guessing. Three things move the benchmark.
Account size
Smaller accounts almost always post higher rates. A creator with 5k followers hears from a large share of them; a creator with 5M does not. Rates fall as follower count rises, on every platform.
Compare the creator to accounts in the same follower band, never to a generic number.
Platform
TikTok, YouTube and X produce view-based rates; Instagram feed posts use a follower-based rate. The denominators are different, so the numbers are not comparable across networks, and X rates run lower than the video platforms because most posts are read and passed by.
Only compare rates calculated the same way on the same platform.
Niche and format
Comedy and beauty content draws comments; finance and B2B content gets read and saved. Video formats pull more interactions than static posts on the same account.
Read the rate alongside the creator’s format mix and category, not in isolation.
This is why the calculator does not hand you a fixed target. It shows where the creator sits against other accounts of the same size on the same platform, drawn from the full dataset, so the benchmark is the one that applies to that creator rather than to an average of the whole internet.
How to use it
Calculate an influencer’s engagement rate in three steps
-
Pick the platform and paste the handle
Instagram, TikTok, YouTube, X, Twitch or OnlyFans. Username only, no account, no credit card, no trial clock.
-
Read the rate against the follower band
Ignore the raw percentage until you have seen where it sits against creators of the same size. That comparison is the answer.
-
Check the growth curve and the averages
A good rate with a spiky follower curve or one outlier post is a warning. A steady rate on steady growth with consistent posting is what you want to see.
Reading the number
Five ways engagement rate gets misread
The formula is simple. The mistakes come from what people divide, what they average, and what they compare it to.
-
Calculating it from one post
A giveaway, a viral clip or a collaboration post can triple a creator’s normal numbers. Average across recent posts, and look at the spread, not just the mean.
-
Using followers as the denominator on TikTok, YouTube or X
On algorithm-driven platforms most viewers are not followers. Dividing by followers produces rates of 50% or 200% that mean nothing. Divide by views.
-
Comparing a 10k account to a 1M account
Rates fall as accounts grow. A 1.5% rate on a 2M-follower account can be excellent; the same rate on a 10k account is a red flag. Benchmark within the follower band.
-
Trusting a high rate without checking who is engaging
Engagement pods and purchased interactions inflate the rate with people who will never buy anything. Read it next to audience credibility and the growth curve.
-
Pricing on the rate instead of reach
A 6% rate on 3,000 average views is 180 interactions. Rate tells you the audience is real and attentive; average views tell you how many of them there are. Price on the second, qualify on the first.
The data
Where the numbers come from
Every calculation is built from publicly available information, collected and analyzed from public sources across the open internet, plus partners who provide publicly available data. Nothing behind a login.
Likes, comments, views and follower counts track the creator’s public profile. Benchmarks are built by placing the creator against other public profiles in the same follower band across the full dataset. Audience insights, where shown, are modeled by analyzing a creator’s public engagers over time rather than copied from anyone’s private dashboard.
The dataset behind the tool holds 340M+ creator profiles. Six platforms carry full profile and audience data (Instagram, TikTok, YouTube, X, Twitch and OnlyFans) and connected accounts are tracked across 47 in total. Profiles refresh weekly, and again whenever you export them.
The same data powers the Influencers.club dashboard and our API. This calculator is a single-profile window into it. Full sourcing and refresh detail sits on our data page.
Free tool vs account
What an account adds
The calculator checks one creator at a time. An account turns the same data into a workflow.
| Capability | Free calculator | Influencers.club account |
|---|---|---|
| Engagement rate, averages and growth history | Yes | Yes |
| Benchmark against the same follower band | Yes | Yes |
| Connected accounts across 47 platforms | Yes | Yes |
| Audience credibility, locations and interests | Locked preview | Full access |
| Filter 340M+ creators by engagement rate | Not included | Yes, with 40+ filters |
| Check engagement on a list of creators at once | One at a time | Bulk, with export |
| Track engagement over time | Not included | Yes |
| API access | Not included | Pro plans |
Find creators by engagement rate, not just check it
This calculator reads one creator. An account lets you search 340M+ profiles across six platforms with engagement rate as a filter, enrich a list you already have with the same metrics and contact info, and track the creators you work with as their numbers move.
Every account starts with free credits, so you can run it on your own shortlist before you talk to anyone.
FAQ
Frequently asked questions
Is the engagement rate calculator free?
Yes. Pick a platform, paste a handle and the engagement rate, averages, growth history and connected accounts appear with no signup, no trial and no credit card. Audience data shows as a locked preview. Unlocking it takes an Influencers.club account, which starts with free credits, so that part is free too.
How do you calculate engagement rate?
Two ways, depending on the platform. Engagement rate by followers is (likes + comments) ÷ followers × 100. Engagement rate by views is (likes + comments + shares) ÷ views × 100. Interactions are averaged across the creator’s recent posts rather than taken from one, and the calculator shows the formula that fits the platform, because a follower-based rate on TikTok or YouTube produces numbers that mean nothing.
How do I calculate engagement rate manually?
Take the creator’s last ten or so posts, add up the likes and comments on each, divide by the number of posts to get an average, then divide that average by the follower count and multiply by 100. On TikTok and YouTube, divide by average views instead of followers and include shares. The calculator does this for you and adds the benchmark against creators of the same size, which is the part you cannot do by hand.
What is a good engagement rate?
It depends on the platform, the size of the account and the niche, and a single benchmark number is usually misleading. Smaller accounts almost always post higher rates than large ones, and a view-based TikTok rate is not comparable to a follower-based Instagram rate. That is why the calculator shows an engagement rate distribution, placing the creator against other accounts in the same follower band on the same platform, so you get the answer for that creator rather than in the abstract.
What is a good engagement rate on Instagram?
It falls as the account grows. Accounts under 10k followers typically post rates several times higher than accounts over 1M, so the same percentage can be strong for one and weak for the other. Reels also behave differently from feed posts, which is why the calculator reports Reel likes separately. Use the follower-band comparison in the result rather than a fixed target. For the Instagram-specific formulas and benchmarks, use the Instagram engagement rate calculator.
What is a good engagement rate on TikTok?
TikTok rates should be calculated against views, not followers, and view-based rates run higher than Instagram’s follower-based rates because only people who actually watched are in the denominator. A high rate on low average views is still a small audience, so read the rate together with average views before pricing anything. The TikTok engagement rate calculator goes deeper on the view-based formula.
What is a good engagement rate on YouTube?
YouTube engagement is measured against views, and it runs lower than short-form platforms because watching a long video is itself the commitment and fewer viewers leave a like or comment. The view-to-subscriber ratio is often the more revealing number: a channel whose videos consistently reach a large share of its subscribers has an audience that shows up. The YouTube engagement rate calculator reports both numbers.
What is a good engagement rate on X?
X shows a public view count on every post, so the rate is calculated against views: (likes + replies + reposts) ÷ views × 100. It runs lower than on video platforms because most posts are read and passed by. Replies and reposts are the interactions that matter most, because they are what carries a post beyond the follower list. The X engagement rate calculator covers the view-based formula in detail.
How is engagement measured on Twitch?
Twitch has no likes or comments on a stream to count, so engagement is the share of followers who actually show up: average viewers divided by followers. Read it with stream frequency and follower growth. A channel with a large follower count and a small average audience is a much smaller buy than the follower number suggests.
How is engagement measured on OnlyFans?
Subscriber counts are not public on OnlyFans, so the calculator uses the public profile’s total likes and total posts to give average likes per post, compared with creators posting at a similar volume. It tells you whether the audience is active on the content or subscribed once and went quiet.
Why is my engagement rate different from other calculators?
Usually one of three reasons: a different formula (followers versus views as the denominator, or shares included or not), a different number of posts averaged, or stale data. This calculator shows which formula it applied, averages across recent posts, and works from profiles refreshed weekly, so the number is reproducible. The platform’s own creator dashboard can also differ, because it counts interactions that are not public, such as saves or impressions.
Does a high engagement rate mean the followers are real?
Not on its own. Engagement can be inflated by pods and purchased interactions just as followers can. The signals to read alongside the rate are the follower curve, where a vertical jump without a matching rise in engagement is the tell, and the audience credibility score, which is benchmarked against creators in the same follower band. The influencer analytics tool puts all three on one page.
Can I calculate engagement rate for a private profile?
No. The calculator only works on public profiles. If an account is private there is no public data to calculate from, and you will get a message telling you so.
Can I check engagement rate for many creators at once?
The free calculator runs one handle at a time. An Influencers.club account lets you upload a list of creators and get engagement rate and supporting metrics on all of them, or search 340M+ profiles with engagement rate as a filter and export the results. Accounts start with free credits.
Can I get engagement rate through an API?
Yes. Engagement rate and every supporting metric on this page are available through the Influencers.club API as structured JSON, across 19 documented endpoint groups covering discovery, profile metrics, audience data, contact info and creator tracking. Onboarding is self serve with free credits. API access comes with Pro plans.
How is this different from the influencer analytics tool?
The calculator is focused on the engagement rate and the numbers that explain it. The influencer analytics tool runs the full profile report on the same creator: estimated revenue, audience credibility, top locations, interests, tagged brands, hashtags and similar accounts. Start here if you want the rate; go there if you want everything.