
Free X (Twitter) Engagement Rate Calculator
Get X accounts’ engagement rate and other metrics from 340M+ accounts for free. No signup.
Sample output for @cristiano. Run the tool on any X / Twitter handle for a live report.

Cristiano Ronaldo
@cristiano
Get EmailBio
Footballer. @AlNassrFC & Portugal 🇵🇹
- Name
- Cristiano Ronaldo
- Location
- Belarus
- Language
- English
- Business Category
- Athlete
- Followers
- 113.4M
- Engagement Rate
- 0.34%
- Tweets
- 4,510
- Average Views
- 18.1M
- Tweets per Month
- 17.3
- Average Likes
- 494.9k
- Average Retweets
- 35.1k
Platforms used
Links in bio
https://www.cristianoronaldo.com/Estimated Revenue
Monthly
$540,000 – $860,000
Revenue Range
Similar Accounts

David de Gea
- Followers
- 27.3M
- Engagement Rate
- 0.21%

Al Nassr FC
- Followers
- 5.1M
- Engagement Rate
- 0.84%

Portugal
- Followers
- 4.4M
- Engagement Rate
- 0.67%

Bruno Fernandes
- Followers
- 6.8M
- Engagement Rate
- 0.35%
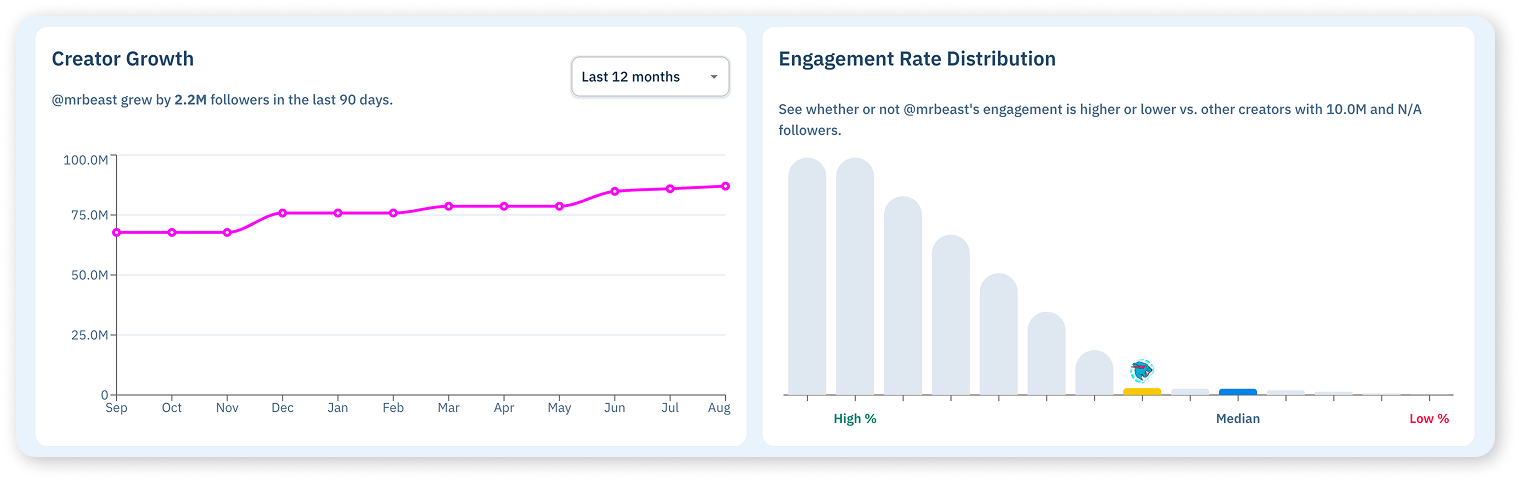
Creator Growth
@cristiano grew by 1.5M followers in the last 90 days.
Engagement Rate Distribution
See whether or not @cristiano's engagement is higher or lower vs. other creators in the same follower band.
Audience Insights
Categories derived from bio, hashtags & language signals
Audience Credibility
Scored against creators in the 113.4M follower band.
Top Locations
+12 more countries
Age & Gender
Audience Interests
+18 more interest categories
Tagged Creators
 selecaoportugal
 alnassrfc
 ewc_en
Tagged Brands
 nike3 post(s)
 binance2 post(s)
 herbalife2 post(s)
Hashtags
Sample report shown for illustration. Run the tool above for a live report.
The basics
What is X (Twitter) engagement rate?
X (Twitter) engagement rate is the share of people who saw a post and then interacted with it, shown as a percentage. It adds up likes, replies and reposts across recent posts, averages them per post, divides by average views and multiplies by 100. X shows a public view count on every post, so views are the honest denominator, the same as on TikTok and YouTube.
X is the platform where engagement rate and follower count disagree the most. Reach depends on the For You feed, quote posts and who replies, so a 30k-follower account can outreach a 1M-follower account on a given day. Rates also run lower than on video platforms, because most posts are read and passed by without a tap, and that is normal rather than a problem.
(likes + replies + reposts) ÷ views × 100
The formula that reflects what actually happened. Everyone in the denominator saw the post, so the rate measures how many readers acted. Replies and reposts are the interactions that carry a post beyond the follower list.
(likes + replies + reposts) ÷ followers × 100
The older method, still used by tools built before X made view counts public. Shown for comparison. It swings with whatever the feed did that week rather than with how the audience behaves.
Inside the result
What the X (Twitter) engagement rate calculator shows you
An X engagement rate without average views next to it is half a number. The calculator returns both, with the metrics that explain them.
The rate, with the views and reply mix behind it
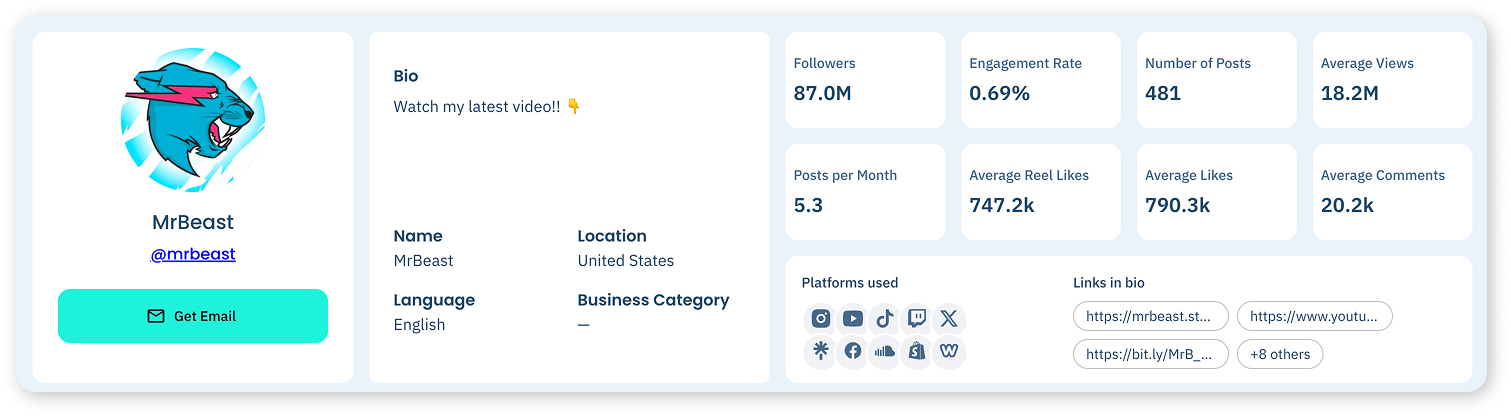
You get the view-based engagement rate averaged across the account’s recent posts, next to average views, likes, replies and reposts per post, posting frequency and follower count. Average views tells you the real audience per post; the split between likes, replies and reposts tells you what kind of engagement it is.
- Engagement rate
- Followers
- Average views
- Average likes
- Average replies
- Average reposts
- Posts per month
- Total posts
Posting volume matters on X more than on any other platform. An account posting thirty times a day and one posting three times a day can show the same headline rate with completely different audiences behind it, because high volume dilutes views per post while keeping the account in the feed. The frequency number is there so you can read the rate in that light.
Where the rate sits against X accounts of the same size
X rates are lower than on visual platforms by construction, so a benchmark borrowed from Instagram or TikTok is useless. The calculator places the account on an engagement rate distribution built from X accounts in the same follower band, so “is this good” gets answered for that size on that platform.
Next to it you get the follower curve over the last 12 months and the followers added in the last 90 days. X follower spikes usually trace to one viral post or a news moment, so the thing to check is whether average views held up afterwards or fell back to where they were.
Every account the creator runs, not just the X handle
Most X engagement rate calculators check one handle and stop. This one resolves the creator behind the handle and shows every account connected to them, with follower counts on each. X is often where a creator’s opinions live and rarely where their largest audience does, so the full footprint changes the conversation about reach and price.
Matching runs against 340M+ creator profiles, with connected accounts tracked across 47 platforms, which is why the result finds channels a single X (Twitter) search never surfaces.
- Linked accounts
- Followers per platform
- Public bio
- Links in bio
- Location
- Language

Benchmarks
What is a good X (Twitter) engagement rate?
There is no single good X engagement rate, and any calculator that hands you one is guessing. Three things move the benchmark.
Account size
Rates fall as follower count rises, and on X they fall from a lower starting point than elsewhere. A 5k-follower account in an active niche can post rates several times higher than a 1M-follower account, and both can be healthy.
Compare the account to X creators in the same follower band, never to a number from another platform.
Post type
Image and video posts draw more likes and views; text posts and threads draw more replies and reposts; polls draw votes that do not show in any of the counts. An account that posts mostly media will show a different rate from one that posts mostly text, for reasons unrelated to audience quality.
Look at the mix of likes, replies and reposts, and match it to the kind of post you are commissioning.
Where the reach comes from
A post that travels through quote posts and replies reaches people who have never seen the account; a post that only reaches followers does not. Reposts and quotes are the interactions that tell you an audience is passing content on rather than just seeing it.
Weigh reposts and replies over likes when the deliverable is distribution, and views over everything when it is awareness.
This is why the calculator does not hand you a fixed target. It shows where the account sits against other X creators of the same size, drawn from the full dataset, so the benchmark is the one that applies to that creator rather than to an average of the whole platform.
How to use it
Calculate a X (Twitter) engagement rate in three steps
-
Paste the X handle
Username only, with or without the @. No account, no credit card, no trial clock.
-
Read the rate next to average views
The rate tells you how readers react; average views tell you how many of them there are. You need both before the number means anything.
-
Check the follower band and the reply mix
See where the rate sits against X accounts of the same size, then look at whether the engagement is likes, replies or reposts, because those three mean different things.
Reading the number
Five ways X (Twitter) engagement rate gets misread
X is a text-first platform with a video-first feed, and most engagement mistakes come from treating it like somewhere else.
-
Comparing an X rate to an Instagram or TikTok rate
X rates run lower than on visual platforms because most posts are read and passed by. A 1% rate on X and a 1% rate on Instagram are not the same signal and should never be compared.
-
Reading one viral post
One post that gets quoted by a large account can pull 10M views on an account that averages 20k. Look at the spread across recent posts, and check whether the median looks anything like the mean.
-
Dividing by followers
View counts are public on every X post, so there is no reason to use followers as the denominator. A follower-based rate reflects what the feed did that week, not how the audience behaves.
-
Treating all replies as good engagement
A post with more replies than likes is usually being argued with, not agreed with. A high reply count on its own is not a positive signal; read it against likes and reposts.
-
Ignoring posting volume
An account posting thirty times a day spreads its audience thin across posts. The rate and the average views both drop for reasons that have nothing to do with audience quality. Read both against posts per month.
The data
Where the numbers come from
Every calculation is built from publicly available information, collected and analyzed from public sources across the open internet, plus partners who provide publicly available data. Nothing behind a login.
Views, likes, replies, reposts and follower counts track the creator’s public X profile and are refreshed weekly. Benchmarks are built by placing the creator against other public X (Twitter) profiles in the same follower band across the full dataset. Audience insights, where shown, are modeled by analyzing a creator’s public engagers over time rather than copied from anyone’s private dashboard.
The dataset behind the tool holds 340M+ creator profiles. Six platforms carry full profile and audience data (Instagram, TikTok, YouTube, X, Twitch and OnlyFans) and connected accounts are tracked across 47 in total. Profiles refresh weekly, and again whenever you export them.
The same data powers the Influencers.club dashboard and our API. This calculator is a single-profile window into it. Full sourcing and refresh detail sits on our data page.
Free tool vs account
What an account adds
The calculator checks one creator at a time. An account turns the same data into a workflow.
| Capability | Free calculator | Influencers.club account |
|---|---|---|
| Engagement rate, averages and growth history | Yes | Yes |
| Benchmark against the same follower band | Yes | Yes |
| Connected accounts across 47 platforms | Yes | Yes |
| Audience credibility, locations and interests | Locked preview | Full access |
| Filter 340M+ creators by engagement rate | Not included | Yes, with 40+ filters |
| Check engagement on a list of creators at once | One at a time | Bulk, with export |
| Track engagement over time | Not included | Yes |
| API access | Not included | Pro plans |
Find creators by engagement rate, not just check it
This calculator reads one creator. An account lets you search 340M+ profiles across six platforms with engagement rate as a filter, enrich a list you already have with the same metrics and contact info, and track the creators you work with as their numbers move.
Every account starts with free credits, so you can run it on your own shortlist before you talk to anyone.
Other platforms
Engagement rate calculators for every platform
Each platform counts engagement differently, so each calculator applies the formula that fits it.
 Instagram engagement rate calculator
 TikTok engagement rate calculator
 YouTube engagement rate calculator
 Twitch profile analyzer
 OnlyFans profile analyzer
FAQ
Frequently asked questions
Is the X engagement rate calculator free?
Yes. Paste an X handle and the engagement rate, averages, growth history and connected accounts appear with no signup, no trial and no credit card. Audience data shows as a locked preview. Unlocking it takes an Influencers.club account, which starts with free credits, so that part is free too.
How do you calculate X (Twitter) engagement rate?
(likes + replies + reposts) ÷ views × 100, averaged across the account’s recent posts rather than taken from one. X shows a public view count on every post, so views are the denominator, the same as on TikTok and YouTube. The calculator also shows the follower-based version for comparison with tools built before view counts were public.
How do I calculate Twitter engagement rate manually?
Take the account’s last ten or so posts, add up the likes, replies and reposts on each, divide by the number of posts to get an average, then divide that average by the average views and multiply by 100. The calculator does this for you and adds the benchmark against X accounts of the same size, which is the part you cannot do by hand.
What is a good engagement rate on X?
It depends on the size of the account and the type of posts, and it runs lower than on video platforms because most posts are read and passed by without a tap. Replies and reposts matter more than likes, because they are what carries a post beyond the follower list. The calculator shows an engagement rate distribution, placing the account against other X creators in the same follower band, so you get the answer for that account rather than in the abstract.
Should X engagement be measured against views or followers?
Views. X shows a public view count on every post, so there is no need to use followers as a proxy for reach. A follower-based rate swings with whatever the For You feed did that week; a view-based rate measures how many of the people who actually saw the post reacted to it.
Why is my rate different from X Analytics?
X Analytics counts interactions that are not public, such as profile clicks, link clicks, bookmarks and detail expands, and reports impressions from the account’s own side. Public calculators can only use public views, likes, replies, reposts and followers. The numbers will differ, and that is expected. What matters is that the same public formula is applied to every account, so creators are comparable with each other.
Does a high X engagement rate mean the followers are real?
Not on its own. Purchased followers on X are common and purchased engagement is cheap. The signals to read alongside the rate are average views relative to followers, where a large follower count with tiny views is the tell, the follower curve, and the audience credibility score, which is benchmarked against X accounts in the same follower band. The profile analyzer puts all of them on one page.
Can I calculate engagement rate for a protected X account?
No. The calculator only works on public profiles. If an account is protected there is no public data to calculate from, and you will get a message telling you so.
Can I check engagement rate for many X accounts at once?
The free calculator runs one handle at a time. An Influencers.club account lets you upload a list of X creators and get engagement rate and supporting metrics on all of them, or search 340M+ profiles with engagement rate as a filter and export the results. Accounts start with free credits.
Can I get X engagement rate through an API?
Yes. Engagement rate and every supporting metric on this page are available through the Influencers.club API as structured JSON, across 19 documented endpoint groups covering discovery, profile metrics, audience data, contact info and creator tracking. Onboarding is self serve with free credits. API access comes with Pro plans.
How is this different from the profile analyzer?
This calculator is focused on the engagement rate and the numbers that explain it. The profile analyzer runs the full profile report on the same account: estimated revenue, audience credibility, top locations, interests and similar accounts. Start here if you want the rate; go there if you want everything.